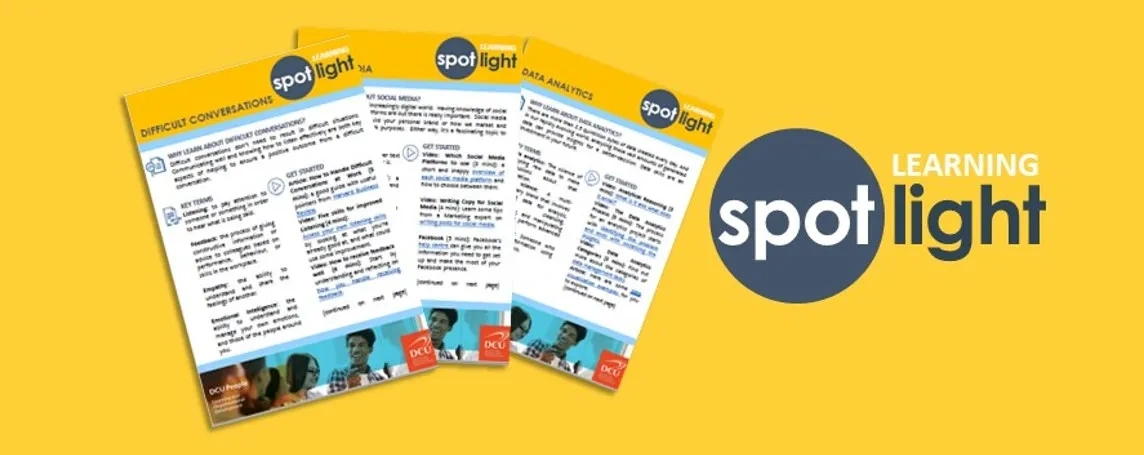

Learning Spotlight | Data Analytics
WHY LEARN ABOUT DATA ANALYTICS?
There are more than 2.5 quintillion bytes of data created every day. And in our rapidly evolving world, analysing these vast amounts of generated data can provide insights for a better-decision. Data skills are an investment in your future.
Data analytics: The science of analysing raw data to make conclusions about that information.
Data science: A multidisciplinary blend that involves preparing data for analysis, including cleansing, aggregating, and manipulating the data to perform advanced data analysis.
Data analyst: Someone who scrutinises information using data analysis tools.
FOLLOW-ON ACTIVITIES
Broaden your understanding of what’s possible using data analytics by finding out about the Insight Centre for Data Analytics. Based on DCU Glasnevin Campus, it’s one of the biggest data analytics centres in Europe.
Try a Data Analytics tool on your own data by downloading a trial of one of the tools listed here.
GET STARTED
Video: Analytical Reasoning (3 mins): What is it and what does it entail?
Video: The Data Analytics Process (5 mins): The process for an analytics project starts with identifying the problem and ends with socialising the insights.
Video: Data Analytics Categories (3 mins): Find out more about the categories of data management tasks.
Article: Here are some data visualisation examples for you to explore
Video: Data Visualization (2 mins): Avoid ‘vanity metrics’ and learn about the fundamentals underlying good data visualisation.
Course: If you’re familiar with Excel, get started using Data with Working with Real-Time Data in Excel (1 hour 18 mins)
DIG DEEPER
This comprehensive Learning Data Analytics course (100 mins) explains data, data analysis roles, data fields and types, syntax and how to interpret existing data. It covers data best practices, how to repurpose data and create a data dictionary, how to link and embed charts and data and how to build pivot charts.
